by Francesco Agnoletto
How to add a trending section to your gatsby blog
Display the most popular pages on your website
March 09, 2020I always wanted to have a trending page in the blog to display the most viewed articles.
There are many ways to collect data, but getting the data back is not as easy. I found guides to set up servers, outdated plugins but nothing simple for the average website using Google analytics.
I’m using gatsby-plugin-google-analytics to get visitors data on my blog. Unfortunately, Google does not make it easy to understand how you are supposed to query the data it collects.
Additionally, the only plugin available for gatsby is poorly documented and has not been updated for the last year and a half. npm audit also highlights high vulnerabilities on the package from outdated dependencies.
Checking the code from the plugin, I found out it uses Google Reporting’s v3 API. Google’s ability to suddenly drop products is quite renowned, so I wanted to rely on the latest v4 API.
Making sure analytics works with the Reporting API
The first step, assuming Google analytics is already set up, is to make sure we can get data from it.
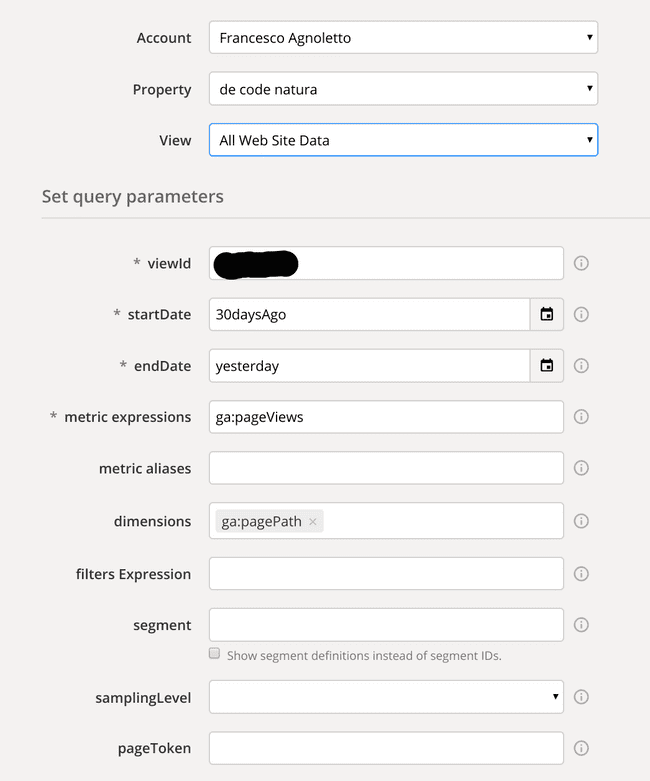
Google makes available the Request Composer, a simple form using the Analytics Reporting v4 API to show how to query data with it. Using your account, you should be able to query data from your site.
 Example query requesting the page views for the last 30 days.
The viewId property can be found on your Google analytics account > admin > View Settings.
Make sure to launch the query and check the result to confirm it works as it should.
Creating a Viewer account
We need a Google Cloud account to be able to query the data successfully.
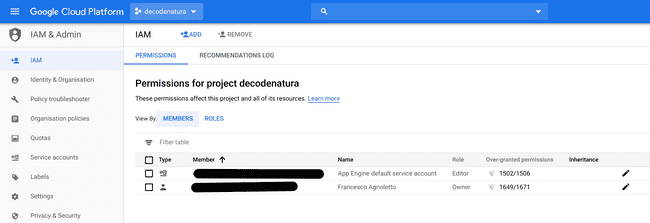
The default users’ permissions do more than what we need.
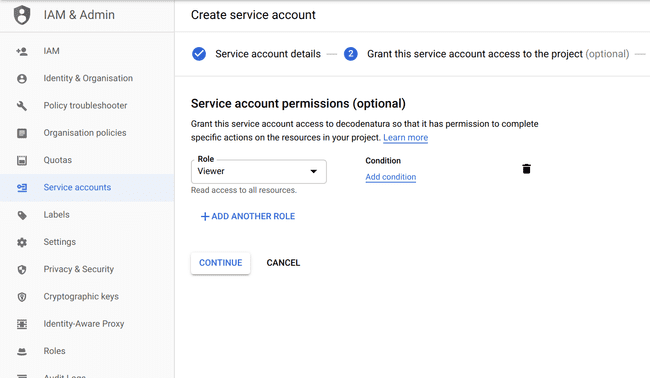
I prefer to create a new account with just the Viewer role, it limits the scope of the account and is less of a problem if somehow the key gets exposed.
To create a new user, navigate to Service accounts from the sidebar and + Create Service Account.
Give it the name you want but make sure it has only the Viewer role.
Once this is done, in the third and last screen + Create Key and then Done.
There should be a new account with the Viewer role in the dashboard now. We will use the downloaded JSON file to authenticate with Google in our application.
Getting data from the Reporting API
Now we can start working on our gatsby project.
npm i dotenv googleapis will add dotenv and the Google API client to our repository to make sure we can use our data safely and query the analytics data.
Create an empty .env file at the root of the project and add inside the PRIVATEKEY, CLIENTEMAIL from the JSON and the VIEWID from Analytics. The .env should be .gitignore‘d, for production set the environment variables in the service you are using.
// gatsby-node.js
// google auth logic
const crypto = require("crypto");
const { google } = require("googleapis");

require("dotenv").config();

exports.sourceNodes = async ({ actions }) => {
  const { createNode } = actions;

  // google auth logic
  const scopes = "https://www.googleapis.com/auth/analytics.readonly";
  const jwt = new google.auth.JWT(
    process.env.CLIENT_EMAIL,
    null,
    process.env.PRIVATE_KEY,
    scopes
  );
  await jwt.authorize();

  const analyticsReporting = google.analyticsreporting({
    version: "v4",
    auth: jwt,
  });

  // Analytics Reporting v4 query
  const result = await analyticsReporting.reports.batchGet({
    requestBody: {
      reportRequests: [
        {
          viewId: process.env.VIEWID,
          dateRanges: [
            {
              startDate: "30DaysAgo",
              endDate: "today",
            },
          ],
          metrics: [
            {
              expression: "ga:pageviews",
            },
          ],
          dimensions: [
            {
              name: "ga:pagePath",
            },
          ],
          orderBys: [
            {
              sortOrder: "DESCENDING",
              fieldName: "ga:pageviews",
            },
          ],
        },
      ],
    },
  });

  // Add analytics data to graphql
  const { rows } = result.data.reports[0].data;
  for (const { dimensions, metrics } of rows) {
    const path = dimensions[0];
    const totalCount = metrics[0].values[0];
    createNode({
      path,
      totalCount: Number(totalCount),
      id: path,
      internal: {
        type: `PageViews`,
        contentDigest: crypto
          .createHash(`md5`)
          .update(JSON.stringify({ path, totalCount }))
          .digest(`hex`),
        mediaType: `text/plain`,
        description: `Page views per path`,
      },
    });
  }
};
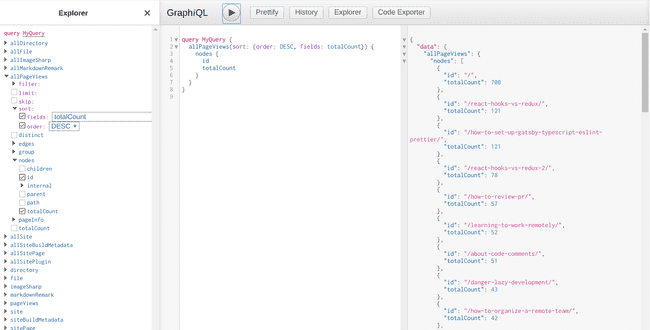
Now run npm start and check localhost:8000__graphql there should be two new fields to query, pageViews and AllPageViews. The first takes an id (slug) as parameter, the second displays all pages.
Displaying the new data
Now that we can get our numbers from graphql, it is time to create a new route for it.
I opted for a new route called /popular to display my articles sorted by views.
// src/pages/popular.tsx

import React from "react";
import { Link, graphql } from "gatsby";

import { ArticleCard } from "../components/styled";

interface IProps {
  data: {
    allMarkdownRemark: {
      edges: Array<{
        node: {
          excerpt: string;
          fields: {
            slug: string;
          };
          frontmatter: {
            date: string;
            title: string;
            description: string;
          };
        };
      }>;
    };
    allPageViews: {
      nodes: Array<{ id: string; totalCount: number }>;
    };
  };
}

const PopularPosts: React.FC<IProps> = ({ data }) => {
  const pageViews = data.allPageViews.nodes;

  // add the pageview data to the post objects
  const posts = data.allMarkdownRemark.edges.map(post => {
    const { slug } = post.node.fields
    const currentPageViews = pageViews.find(
      filteredPageViews => filteredPageViews.id === slug
    )?.totalCount;
    return {
      ...post,
      pageViews: currentPageViews || 0,
    };
  });

  return (
    <div>
      <h1>Most popular Articles</h1>
      {posts
        .sort((postA, postB) => postB.pageViews - postA.pageViews)
        .map(({ node }) => {
          const title = node.frontmatter.title || node.fields.slug;
          return (
            <ArticleCard key={node.fields.slug}>
              <small>{node.frontmatter.date}</small>
              <h3>
                <Link to={node.fields.slug}>{title}</Link>
              </h3>
              <p
                dangerouslySetInnerHTML={{
                  __html: node.frontmatter.description || node.excerpt,
                }}
              />
            </ArticleCard>
          );
        })}
    </div>
  );
};

export default PopularPosts;

export const pageQuery = graphql`
  query {
    allMarkdownRemark(sort: {
      fields: [frontmatter___date],
      order: DESC
    }) {
      edges {
        node {
          excerpt
          fields {
            slug
          }
          frontmatter {
            date(formatString: "MMMM DD, YYYY")
            title
            description
          }
        }
      }
    }
    allPageViews(sort: { order: DESC, fields: totalCount }) {
      nodes {
        id
        totalCount
      }
    }
  }
`;
The npm package
Open source is the best part of the JavaScript ecosystem.
I created a gatsby plugin with the code from the Getting data from the Reporting API section. It can be used as an alternative to the code in gatsby-node.js.
Just follow the instructions in the readme and you should be able to set it up in no time.
It is my humble contribution to the amazing gatsby community.


